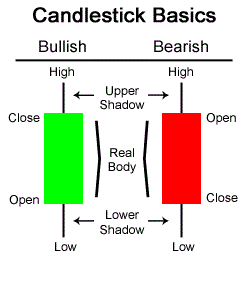
- The Candlestick is a charts which show the important between what happened science the OPEN as well as prior days CLOSE(it display the high,low,opening and closing ).
- Candlesticks are one of the most powerful technical analysis tools in the trader's toolkit
- The Candlestick charts convey the information in a way that is visually efficient or we can say it is a leading indicator of market activity.
See the below Candlestick :
- The difference between the open and the close is called the real body.
- The amount the stock went higher beyond the real body is called the upper shadow.
- The amount it went lower is called the lower shadow.
- If the candle is clear or white it means the opening was lower than the high and the stock went up.
- If the candle is colored then the stock went down.


No comments:
Post a Comment